akinbostanci/E+ via Getty Images
Thesis
They say fear and greed drive markets, and unfortunately, it is true. Investors love to buy stocks when indices are at the highs, and recoil in fear during significant drawdowns. In reality, they should do the opposite:
It has long been market folklore that the best time to buy stocks is when individual investors are bearish, and the best time to sell is when individual investors are bullish.
Source: Robert Neal and Simon Wheatley (1998)
Timing the stock market is an impossible feat, even for institutional investors, let alone retail ones. However, financial engineering has helped put out a number of interesting investment tools in the past few years, one of them being the Innovator U.S. Equity Power Buffer ETF October (BATS:POCT). The vehicle is an exchange-traded fund that utilizes options to cap both the upside and the downside of the S&P 500. In other words, the ETF will never lose as much value as the S&P 500, while it will only participate in some of the upside:
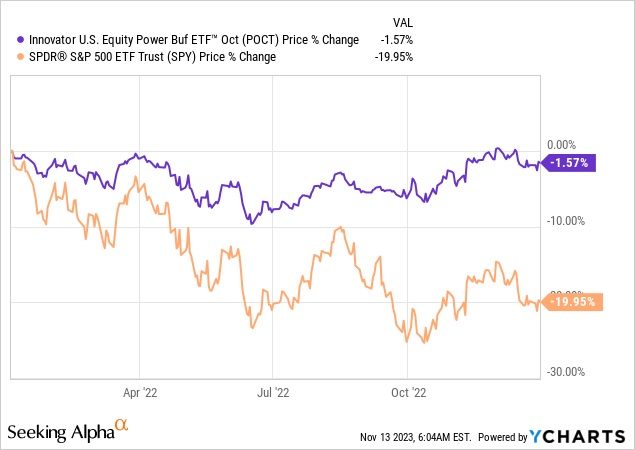
The fund is an ideal tool for a retail investor anticipating a bear market since it sets up a very defensive positioning that allows the elimination of the ‘fear’ aspect. The above graph presents the fund’s performance during 2022, when the S&P 500 was down for the year, with a large -22% drawdown. POCT was down only -1.57% during that year, with a manageable -10% drawdown.
Retail investors need to understand that managing drawdowns is extremely important for a robust long-term portfolio. Buying high beta instruments that leave you with -30% or -40% drawdowns during a bear market can impair your portfolio for years to come. Usually fear and panic take over when such drawdowns occur, and instead of buying, an investor ends up selling at the lows.
Nobody should expect they can time the market. However, what investors can and should do is position themselves for the expectations. If a recession or choppy markets are expected, then sell your high beta names, increase your cash balance, and switch to conservative names such as POCT that reduce your drawdowns but still offer upside:
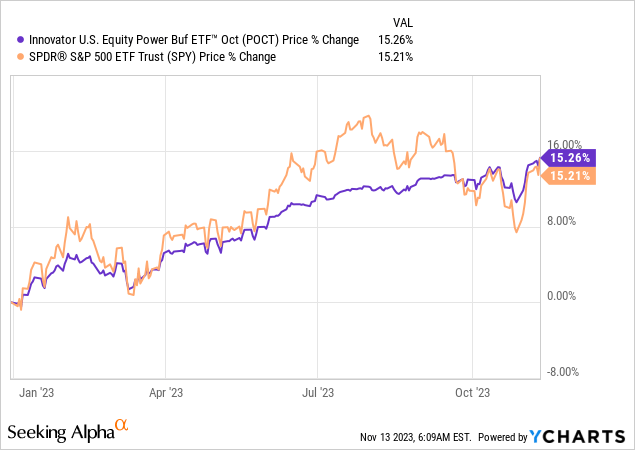
If a retail investor would have switched from the SPY to POCT in January 2022, not only would they have had a manageable 2022, but they would have also captured all the upside in 2023. Since January 1st, 2022, POCT is up 13%, while the SPY is down -7%, both from a pure price perspective.
In this article we are going to go into detail about POCT’s composition, why it is a conservative tool to use to gain S&P 500 exposure during a bear market, and why we favor this name over owning the index right now.
How does POCT achieve its conservative returns – options collars are the answer
The fund achieves its low volatility and upside capture via option collars:
Holdings (Fund Fact Sheet)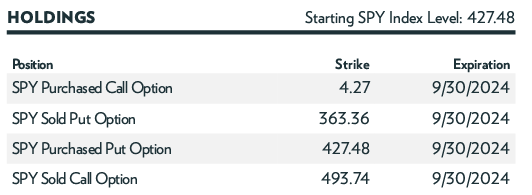
Option collars are simply the addition of put and call options to ‘collar’ or manage a pay-off profile. In this case, the fund has a capped upside at the 493 level via a sold call option, and a capped downside between 427 and 363 via the purchase a put spread. To note that the fund achieves its long SPY position via a deep-in-the-money call option with a 4.27 strike. All of the strikes here are customized, and retail investors do not have access to these exact strikes or the deep-in-the-money option.
The net result is the following pay-off profile:
Scenarios (Fund Fact Sheet)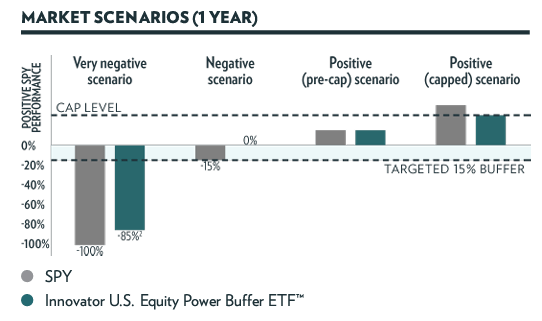
If the SPY moves lower in value, POCT protects you from losses between 427 to 363, but not lower than that level. In exchange for that protection, you give up any upside above 493.
Most bear markets have -20% to -30% drawdowns, hence the downside protection offered is fairly adequate:
Bear Markets (Sol Capital)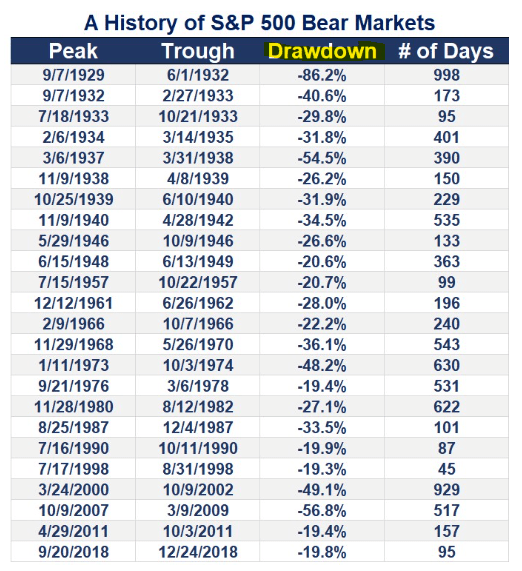
Point in case we saw how the 2022 SPY drawdown was nicely managed by POCT with an equivalent -10% one. The analytics for the fund shape up as follows:
Analytics (Fund Fact Sheet)
The fund has half the beta of the SPY and half the standard deviation. All else equal, expect normalized drawdowns in the SPY to translate into only 0.5x ones for POCT.
Can you replicate yourself the POCT pay-off profile?
One of the critiques of the POCT structure is the assertion that individual investors can replicate the pay-off profile themselves, without needing to pay any fund fees. Let us have a look at whether that is true:
Pay-off Profile (MarketChameleon)
Firstly please note the above construction is done utilizing regular American-style exchange-traded options, hence the strikes are slightly different since the customized ones from POCT are not all available. Also, the public exchanges currently do not quote extremely out-of-the-money high delta call options like POCT uses, but we utilized a long 100 shares position.
Constructing the POCT positioning utilizing these tools gets us the following:
long 100 shares Short 1 call with a 495 strike Long 1 put with a 427 strike Short 1 put with a 365 strike
The net result is a debit of $2.86, meaning an investor would need to pay $286 for this structure. A retail investor needs to understand they would have a significant day 1 cash outlay of 100 x 440 = $44,000 on day one. The minimum for options is 1 contract, which is equivalent to 100 shares of the index. Again, as a retail investor, we do not see on either the E-Trade or Fidelity brokerage platforms in the money call options with a September 2024 expiration date and a strike below 300. The maximum in-the-money option that can be bought by us right now is a 300 strike one.
The takeaway here is that as a retail investor, you can replicate the 1-year payoff profile that POCT offers, but you need a large day 1 cash outlay (i.e., you cannot do just $10,000 of exposure for example), you cannot adjust your position in small sizes throughout the life of the trade (i.e., you cannot add another $20k in exposure, you need to add $44k by doing another contract) and you need to manage the volatility and noise introduced by the structure throughout the life of the deal.
Benefits and risk factors for the fund
There are a number of benefits associated with investing via a structure like POCT versus trying to build a collar outright:
flexibility of invested amounts – as a retail investor you might not have $44,000 increments to invest and might want to allocate only $5,000 monthly for example accessing a return pay-off without the need to understand options – not everybody is an options guru, and many investors only need to understand the downside loss buffering here accessing European style options via POCT, which gives a cost advantage accessing customized strikes and dates via FLEX Options (used by POCT):
FLEX options are customizable products where the investor can set the terms for the tradable contract and have the security of an exchange-traded product. The exercise style, expiration date and strike price can all be chosen by the investor to create a new product that is not currently being traded at an exchange. In general, investors set the criteria and have their brokerage firm solicit the best possible market-price from different market participants.
There are also a number of risk factors to consider:
capped upside: if you buy the SPY via POCT, you will not participate in any gains above 493 until October 2024 the downside is not protected when the SPY gaps down below 363 the fund is less liquid when compared to the SPY
Conclusion
POCT is an equity exchange-traded fund. The vehicle is a conservative take on the S&P 500 via its collar structure, which buffers the downside while capping the upside. Since January 1st, 2022, POCT is up 13%, while the SPY is down -7%, while POCT experienced a mere -10% drawdown in 2022.
Retail investors can replicate the collar structure on their own, but they lack the flexibility offered by an ETF. To that end doing 1 contract of SPY collars requires a $44,000 amount currently, with increments that equate to 100 shares. As a retail investor, you cannot do a collar structure on $10,000 worth of SPY exposure as an example.
We are of the opinion that we are currently in a prolonged bear market that will eliminate all the excesses of the zero rates environment experienced in 2020/2021, and a retail investor is best served by taking a conservative positioning in equities via a fund such as POCT. We are a buy for this name versus owning the index outright.
