Art Wager
Costco Wholesale (NASDAQ:COST), with a fortress-like financial foundation, a wide and durable moat, and a transparent and long growth runway, stands out among prospective investments. Those factors undoubtedly play into the 22% gain the shares tallied this year, and when weighing the many positives associated with the company, the most likely question on investors’ minds is whether the current valuation fits Warren Buffett’s idea of “wonderful company at a fair price.”
However, with the runup, the stock is trading well above its one-, three-, and five-year average P/E ratio. Furthermore, the increased valuation is building even though comp and sales growth slowed markedly from Q1 through Q3 of this fiscal year.
The just released Q4 earnings report sheds light on Costco’s prospects.
What Q4 Results Reveal
When assessing the results, investors need to consider that Q4 2023 was a 17-week quarter, whereas Q4 of 2022 was a 16-week quarter. Likewise, FY 2023 was a week longer than FY 2022.
(Note that to account for the variance, I use “adjusted” to report many metrics.)
The company reported GAAP EPS of $4.86 beating consensus by $0.09 and revenue of $78.94 billion surpassing analysts’ estimates by $1.06 billion. The latter metric represents a 9.5% year-over-year growth in revenue.
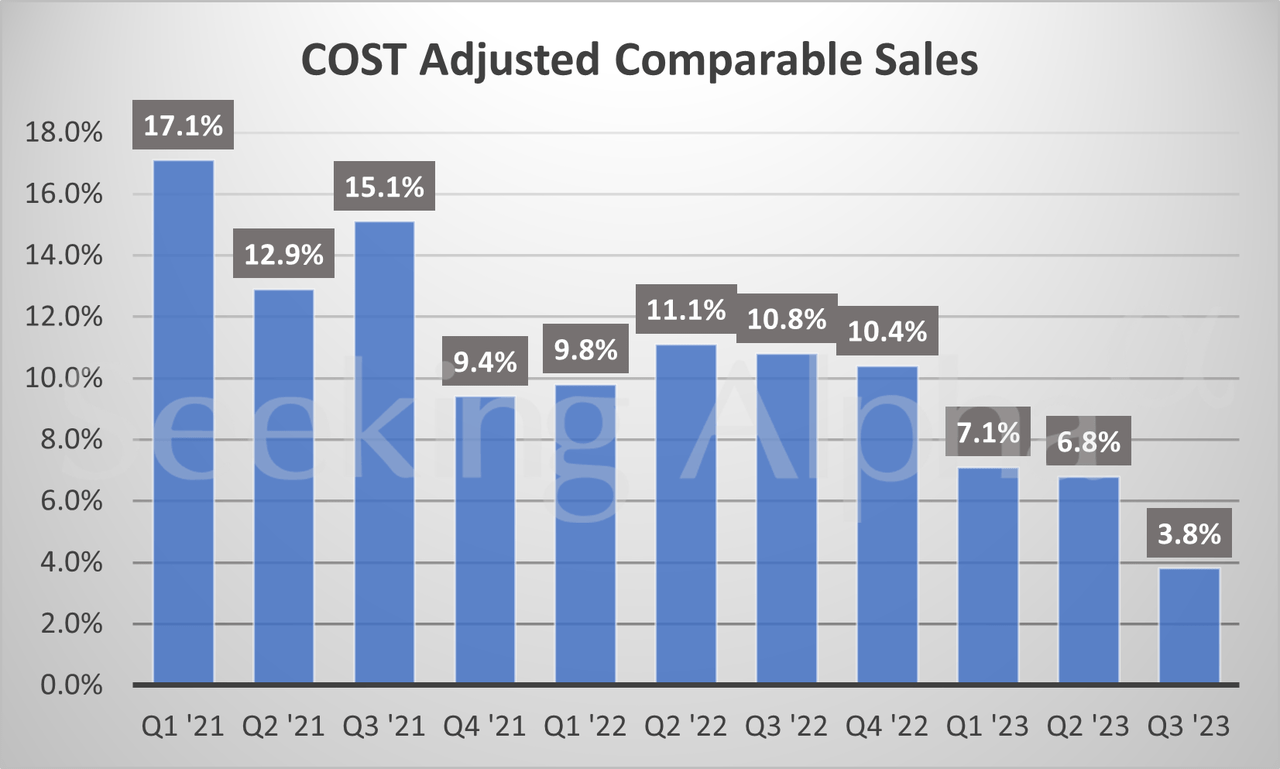
Company wide adjusted comparable sales ticked up 3.8%, with U.S. comps increasing 3.1%, a 7.4% surge in comps in Canada, and a 4.4% growth in comps for International. Those numbers exclude impacts from changes in gasoline prices and foreign exchange rates.
For the fiscal year, company wide adjusted comps were up 5.2%.
Net income for the quarter hit $2.16 billion, compared to $1.868 billion in the 16-week fourth quarter last year.
Net income for the 53-week fiscal year was $6.292 billion, or $14.16 per diluted share. Last fiscal year net income was $5.844 billion, or $13.14 per diluted share.
The closely watched membership fee revenue was up 13.7% to $1.51 billion, beating Wall Street estimates for $1.46 billion. Costco ended the quarter with 71 million household members. That’s a near 8% increase over the comparable quarter. Considering new store openings are up less than 3%, that represents solid growth.
Furthermore, Costco’s customers opting for executive memberships increased by 981,000 over the prior quarter. That’s a positive trend considering Executive Memberships cost $120 versus $60 for the typical annual membership. Executive Memberships now constitute over 45% of all paid memberships, and account for approximately 73% of Costco’s global sales.
Costco has not raised the membership fee since June of 2017. Management has hinted that a hike is under consideration, but otherwise there is no news on that front.
Cash and cash equivalents at quarter’s end were $13.7 billion, up from $10.2 billion in the comparable quarter and long-term debt stood at $5.38 billion.
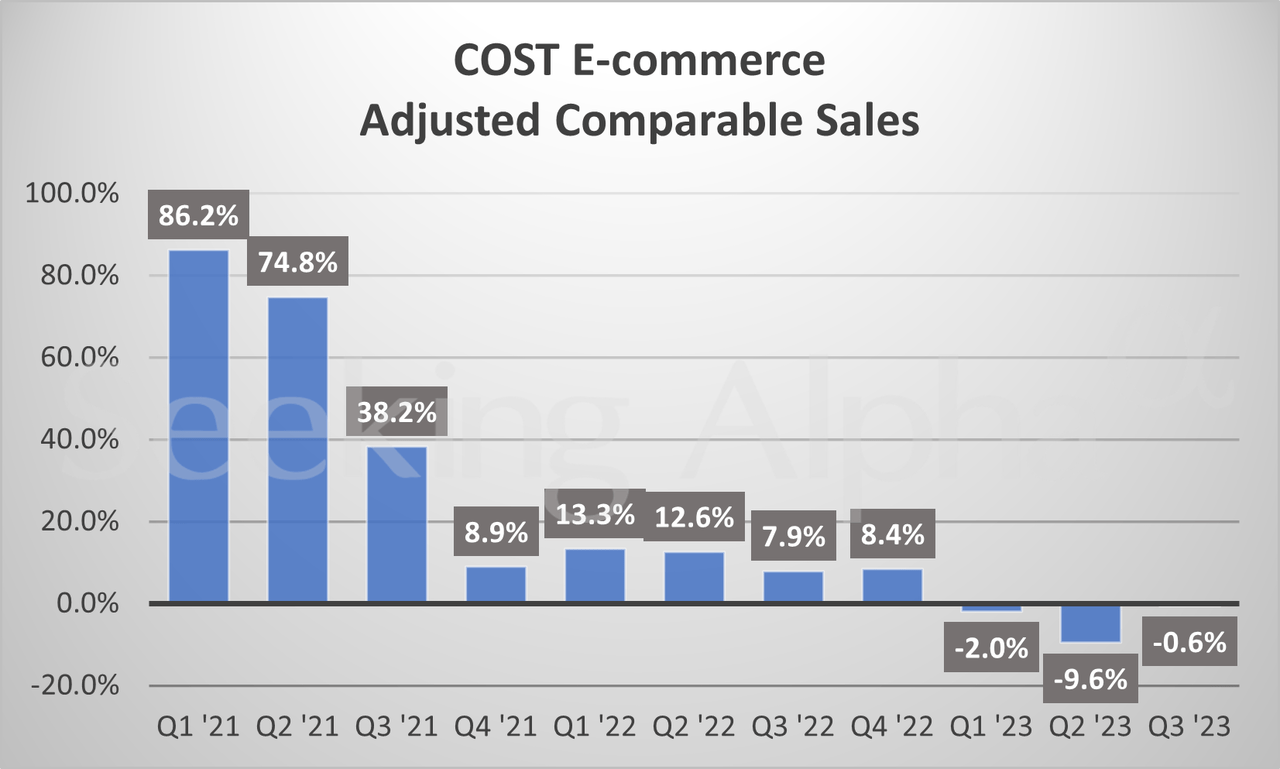
On the negative side, e-commerce sales fell -0.8%.
Where Costco Shines
Costco operates on razor-thin margins. Prior to this earnings release, the company’s trailing-twelve-month profit margin was 2.55%. Nonetheless, the miserly margins COST delivers can actually be counted as a positive. That’s because competitors would have to devote enormous capex to compete with Costco, and the result, if successful, would be that they barely eke out a profit.
In FY 2022, sales were $222 billion while total expenses hit $219 billion. However, the firm also hauled in $4 billion in membership fees over those four quarters. Adding membership fees into the mix, Costco reported net income of $5.8 billion last fiscal year.
That means that despite constituting less than 2% of total sales, memberships provide over three-quarters of the company’s bottom line. And because Costco shoppers routinely renew their memberships at a rate well above 90%, that earns the retailer a strong, recurring revenue stream.
When dissecting Costco, analysts emphasize a metric known as the cash conversion cycle. A cash conversion cycle refers to the number of days needed to convert cash invested in goods into sales. The more rapidly a company converts product into sales, the less money is tied up in inventory.
Argus estimates that Costco turns its inventory over about 12-times a year. Turnover was 12.9-times in FY21 and 12.4-times in FY22, versus a turnover rate of approximately 5x by the average retailer. That means Costco’s cash conversion cycle number is currently negative, a stunningly positive figure.
Another way Costco holds down costs is by owning the stores the firm operates. At the end of FY22, Costco owned the land and buildings of 661 of the 838 warehouse stores. The company also owns 177 properties on leased land.
Another strong advantage lies in the low number of SKUs the company sells. For example, Target (TGT) offers 75,000 SKUs, Costco 4,000. This translates to exceptional leverage with vendors. In turn, this drives down costs. On average, COST marks up merchandise by 11%. That compares to markups of 20% or more for most retailers.
An example of the comparative cost of sales is borne by comparing Costco’s and Target’s sales per square feet. In 2021, COST had $1,600 in sales per square foot, whereas Target garnered a relatively paltry $430 per square foot in sales that year.
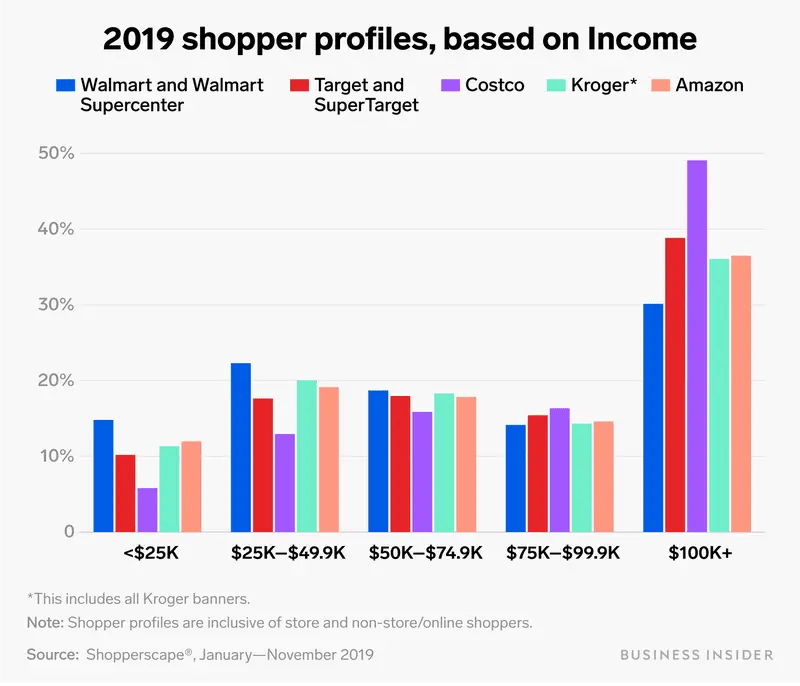
Another edge Costco holds over rivals lies in shopper’s demographics. As the following chart illustrates, Costco has the lead among consumers with incomes above $75,000. With customers earning six-figure incomes, Costco has a double-digit lead.
Business Insider
According to a report by Placer.ai, visits to Costco increased 3% in August, 4.5% in July, and 3.6% in June. The July increase in foot traffic notched the best month for that figure since July of 2022. Visits to competitors’ wholesale clubs and superstores dropped 1.9% in August and 0.4% in June and July.
A Word Regarding The Kroger-Albertsons Deal
Last October, at a cost of $24.6 billion, Kroger (KR) announced the proposed acquisition of Albertsons (ACI). Provided it is approved by regulators, the deal is expected to close early next year. It is assumed that several hundred stores will be spun-off to meet regulatory approval. That would mean the combined companies would push Kroger’s store count from just over 2,700 locations today to about 4,600 units.
This would result in an improved logistics network, increased scale and a stronger competitive position for Kroger. While I do not believe the merger’s approval would present strong headwinds for COST, I will opine that if the deal fails, it would represent a significant positive for Costco. I think Kroger needs the deal to maintain a strong competitive position in the industry.
It is important to note here that In the 12-month period ending on June 30, Kroger’s market share dropped from 12.1% two years earlier to 10.7%, with Walmart (WMT) and Costco gaining market share in that time frame.
Dividend, Debt, and Valuation
COST yields 0.73%, has a payout ratio of 27.47%, and a 5-year dividend growth rate of 13.15%. It should be noted that the company paid a special dividend of $10 in December of 2020, and also paid a special dividend of $5 to $10 on four occasions over the last eleven years..
Debt is rated Aa3 from Moody’s and A+ from Standard & Poor’s. Due to cash and equivalents exceeding debt in FY21 and FY22, Costco had no net debt at the end of those two fiscal years.
COST trades for $557.47 per share. Prior to this quarters’ earnings report, the average 12-month price target of the 20 analysts that follow the stock was $567.96.
The forward P/E of 38.33x is above the 5-year average P/E of 35.85x, and the 5-year PEG of 4.32x is well above the average for that metric of 3.53x.
Is Costco Stock A Buy, Sell, Or Hold?
As noted throughout this article, there are numerous positives when assessing a prospective investment in Costco. A bullet-proof balance sheet, a very strong competitive advantage on several fronts, and a transparently long growth runway all count as reasons why one might invest in the company.
Consider that Costco has just over 800 locations, while Walmart has nearly 3,600 stores in the US, and Target’s store count totals about 1,900, and it is manifest that Costco has ample room for growth.
However, a review of the following chart shows Costco’s comparable sales growth is slowing.
Seeking Alpha
Furthermore, in an era where e-commerce sales are of great import, the Costco’s online sales are struggling.
Seeking Alpha
Perhaps the only negative of any real concern lies in the stock’s current valuation. The shares now trade well above the average one-three-and five-year P/E multiples. The same holds true of the 5-year PEG ratio (4.32x), and analysts forecast earnings to only grow at about 8% per year for the next five years.
No matter how solid the company, valuations matter. Consequently, I must rate COST as a Hold.
Aside from Kroger, I do not have a position in any of the tickers mentioned in this article.


